Reading the Pulse Dashboard
What the Pulse Dashboard shows, who can see it, and how to read each section when something needs attention.
3 min read
The Pulse Dashboard is HireQuotient's internal platform-health board, visible to super-admins only. Open it from ANALYTICS & TRACKING → Pulse Dashboard in the sidebar, or directly at /superAdmin/pulseDashboard on your HireQuotient domain. Think of it as a heart-rate monitor for the product: one place to check whether servers, databases, live channels, and vendors are healthy.
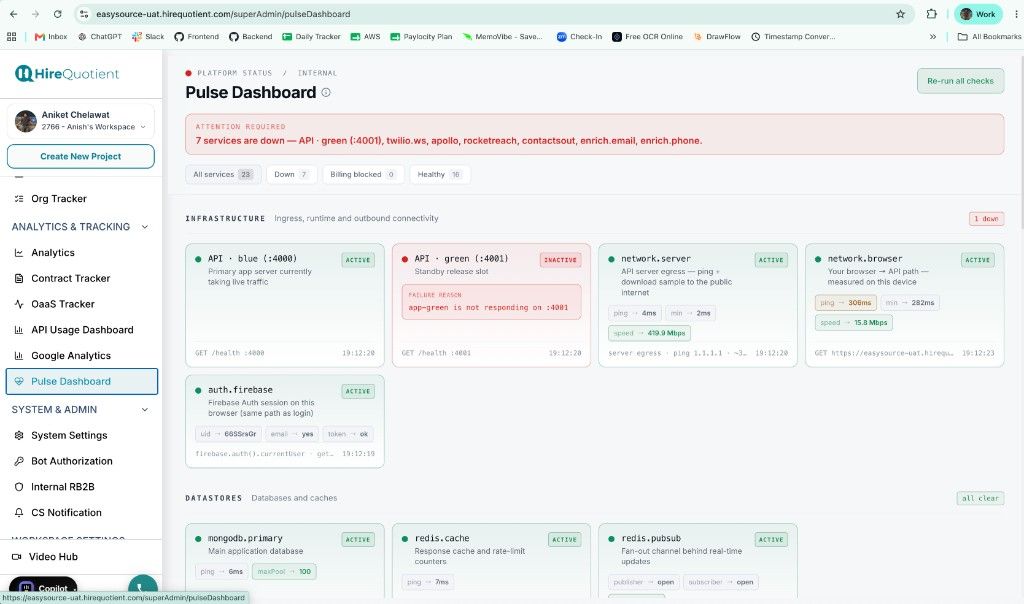
- 1Attention RequiredA red ATTENTION REQUIRED banner at the top lists what needs a look: how many services are down, how many are billing-blocked (vendor credits or payment, not our servers), and which named checks are failing. Filter by All services, Down, Billing blocked, or Healthy, and use Re-run all checks after a fix. A long red list is a triage order, not proof the whole site is offline — confirm API · blue and DataStores before assuming a full outage.
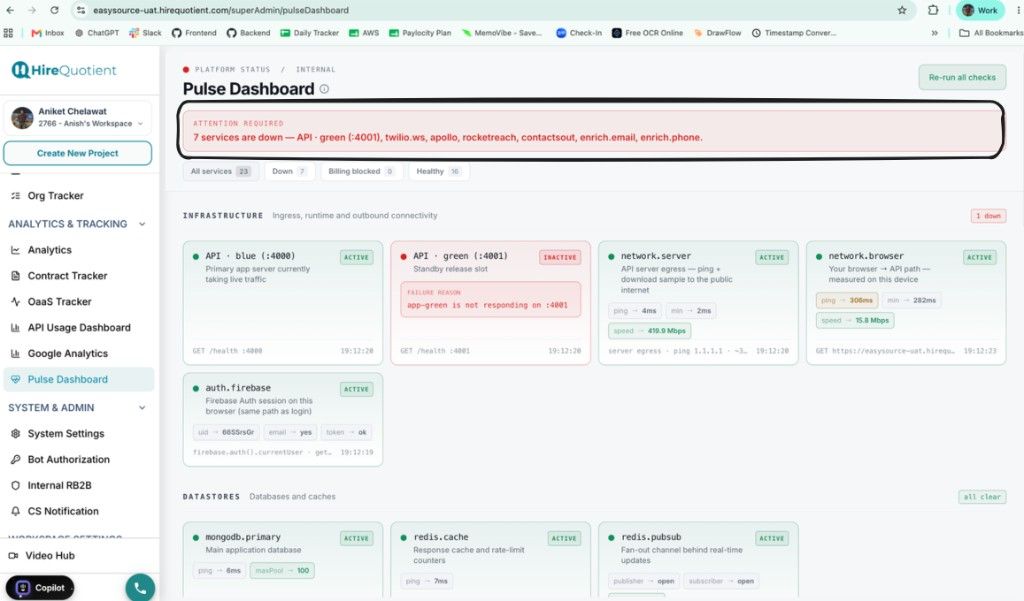
- 2InfrastructureInfrastructure covers ingress, runtime, and outbound connectivity: app servers, outbound network, and Firebase auth. API · blue (:4000) takes live traffic; API · green (:4001) is the standby blue-green slot, so red there alone doesn't mean the product is down — check API · blue first. network.server and network.browser track server-to-internet and browser-to-API reach; auth.firebase confirms the current session is valid. An INACTIVE card's FAILURE REASON gives the exact check that failed.
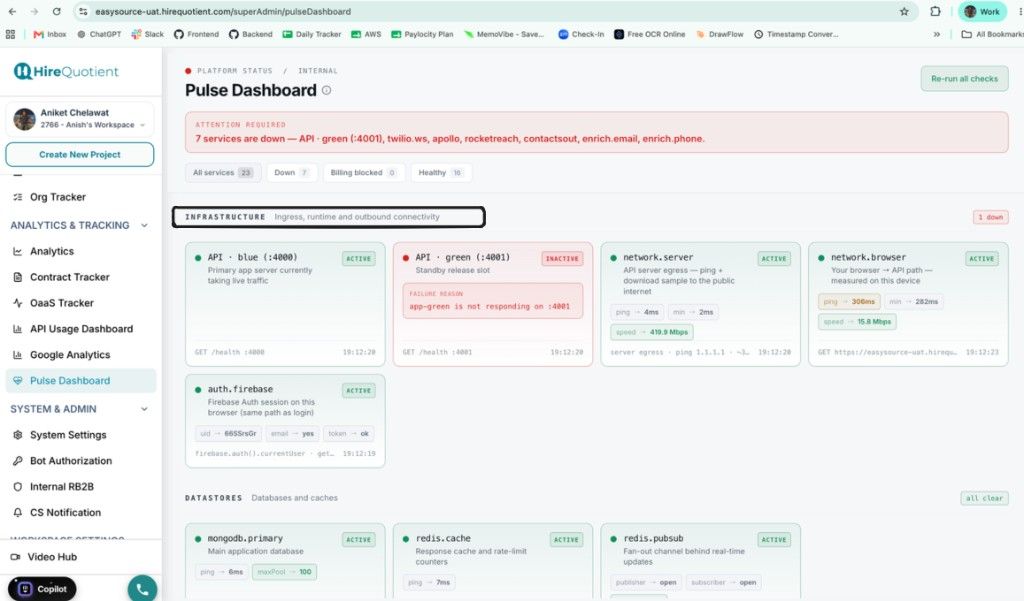
- 3DataStoresDataStores — the databases and caches — is where candidate, project, and session data live: mongodb.primary (ping = response speed, maxPool = connection capacity), redis.cache (short-lived cache and rate limits), and redis.pubsub (live fan-out behind instant UI updates, with publisher and subscriber that should stay open). Treat a red card here as high priority — many features depend on these stores and tend to fail together.
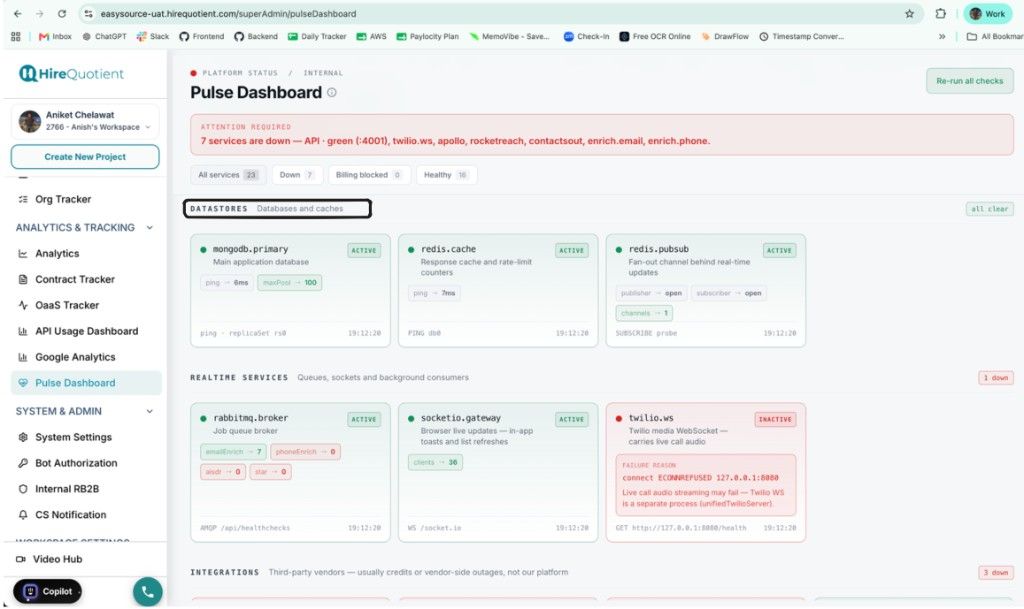
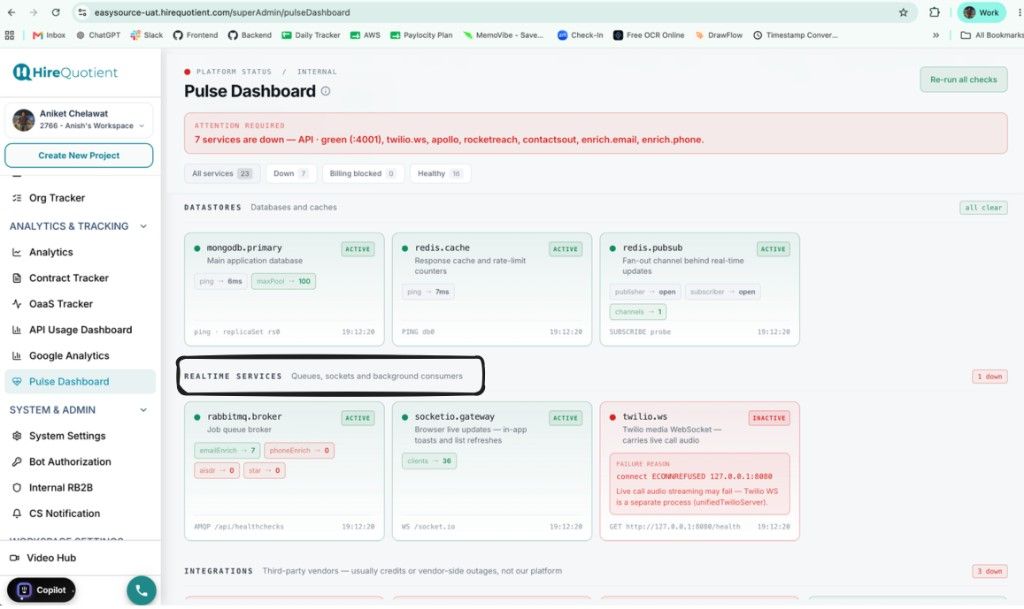
- 4Realtime servicesRealtime services — queues, sockets, and background consumers — cover background jobs and live connections: rabbitmq.broker (the job queue for enrichment and similar work — a growing queue depth means workers are slow or stuck), socketio.gateway (live browser updates, with clients showing open socket connections), and twilio.ws (the media WebSocket carrying live call audio, running as its own process from the main API). A red twilio.ws card — for example a refused connection on port 8080 — means in-app calling may fail even while the rest of the site looks fine; fix or restart the unified Twilio WebSocket service specifically.
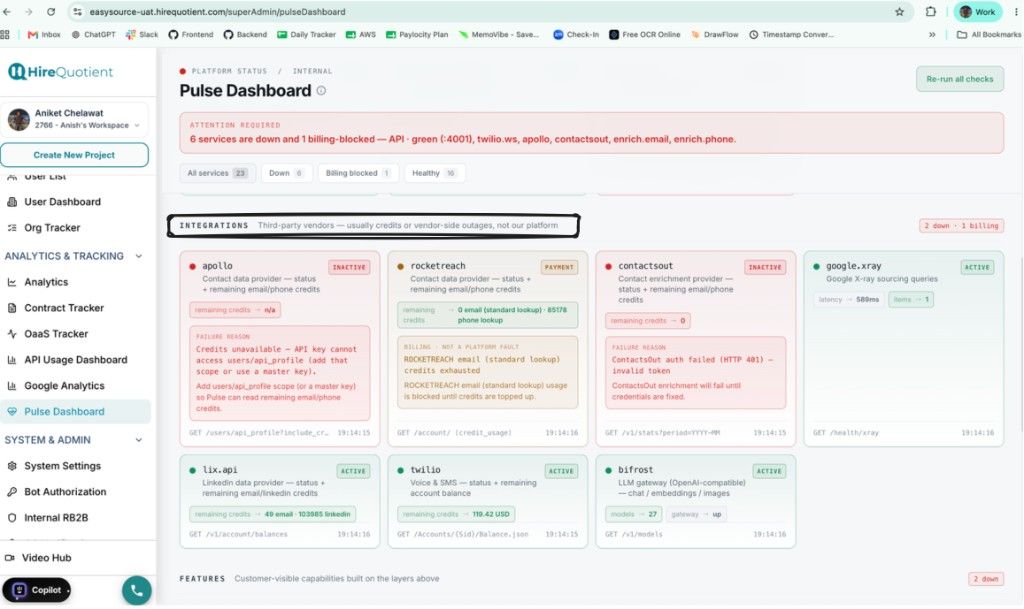
- 5IntegrationsIntegrations — third-party vendors, usually credits or vendor-side outages, not our platform — watches apollo, rocketreach, contactsout, google.xray, and lix.api for enrichment credits; twilio for SMS/voice balance; and bifrost, the OpenAI-compatible LLM gateway for chat, embeddings, and images. ACTIVE means the vendor answered with usable credits; INACTIVE means the probe failed (bad key, missing scope, or no credits); PAYMENT means the account needs billing attention. Read the FAILURE REASON on red cards — it usually points to the vendor's own dashboard rather than a HireQuotient deploy.
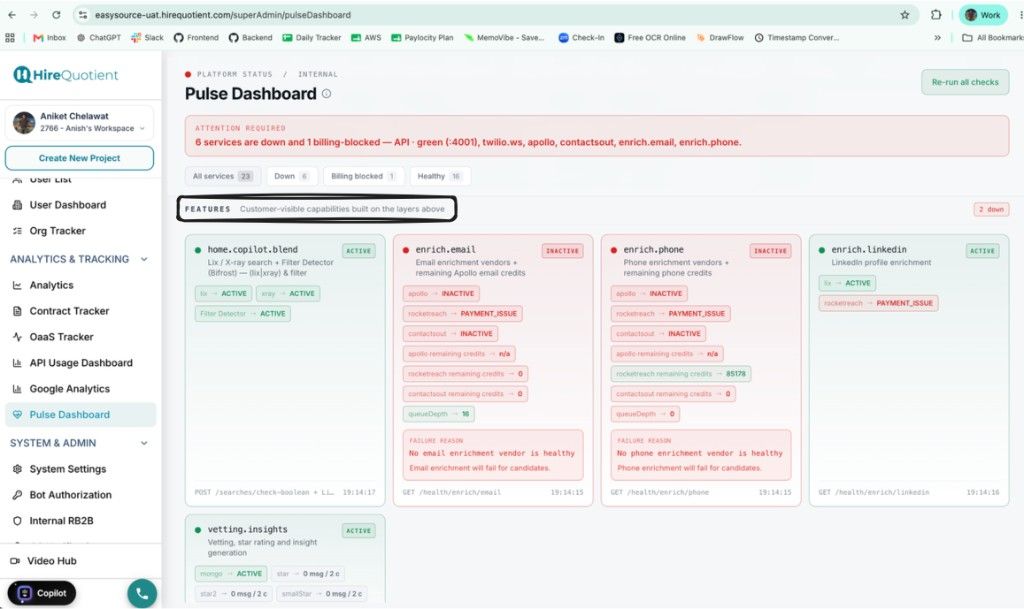
- 6FeaturesFeatures — customer-visible capabilities built on the layers above — is what users actually feel when something breaks: for example home.copilot.blend, enrich.email, enrich.phone, enrich.linkedin, and vetting.insights — each with dependency chips (green = healthy, red/PAYMENT = the break) and a plain-language FAILURE REASON. Suggested triage order: start at Attention Required for the shortlist, open the matching Features card for customer impact, drill into Integrations, Realtime, or Infrastructure for the root cause, then click Re-run all checks once fixed.